Prints
Time & Sales feed showing every individual trade as it executes - price, size, and whether it hit the bid or lifted the ask.
Prints - traders also call it Time & Sales, or just “the tape” - shows every trade as it happens. One row per execution: when it printed, what price it filled at, how many shares, and whether the buyer lifted the ask or the seller hit the bid. The book (Level 2) shows what’s posted; Prints show what actually got done.
Reading the tape is one of the oldest skills in active trading. You’re watching for the texture of flow: are buyers getting filled at the offer (aggressive demand) or are sellers driving price down by hitting bids (aggressive supply)? Are big prints hitting in clusters, or is it retail-sized chop? Block trades crossing through the middle - is that institutional positioning or unwinding? The tape doesn’t tell you the future, but it tells you the present in a way the chart can’t.
In Scanz, Prints lives alongside Level 2 in the same panel. You read both together because they tell complementary stories.
Where Prints Live
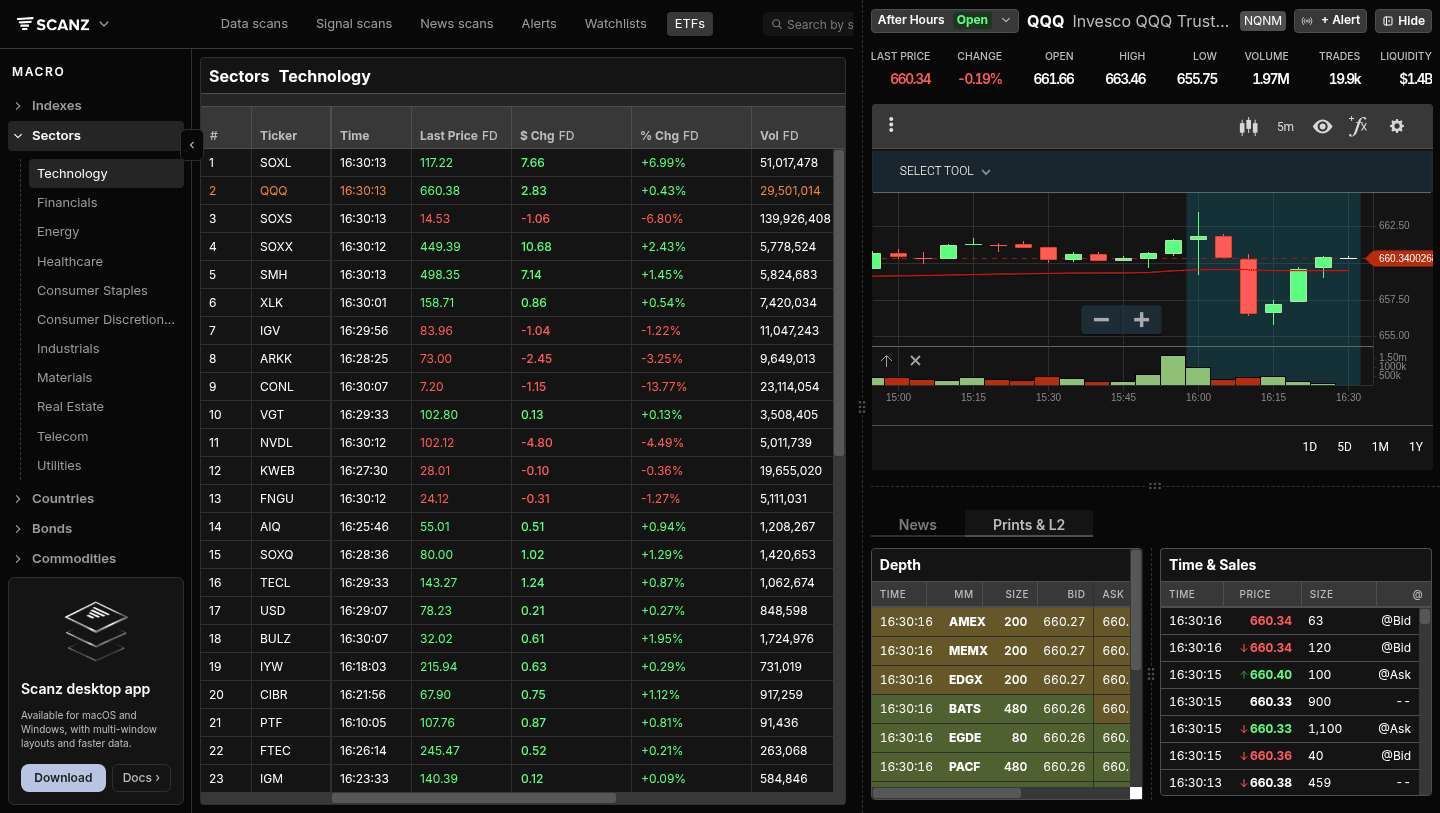
QuickView → Prints & L2 tab. Click any ticker, then click the Prints & L2 tab below the chart. Time & Sales is the right-hand panel; the Depth panel sits to its left. Trades stream into the top of the list as they execute - newest at top.
Montage → Right column. Open the full-page view (right-click any ticker → Open in New Tab) and you’ll see a dedicated Time & Sales panel on the upper-right side, alongside the chart and stats. The bottom of the Montage view has the deeper Level 2 / News / Filings tabs, but Time & Sales is always visible at the top right - because the tape is what you’re watching while you decide.
Both views use the same feed. The Montage version has more rows visible at once; the QuickView version is compact but always one click away from any ticker.
Reading the Tape
Each row in Time & Sales has four columns:
- TIME - When the trade printed (HH:MM:SS, exchange time)
- PRICE - The execution price, with an up arrow (green) if the price ticked up from the previous print or down arrow (red) if it ticked down
- SIZE - Number of shares in this execution
- @ - Where it printed:
@Ask(buyer lifted),@Bid(seller hit), or--(between, often a midpoint print or a print outside the visible spread)
A typical reading session looks like a stream of:
16:33:35  ↑117.33   100   --
16:33:34  ↑117.33   853   --
16:33:34   117.30   200   @Ask
16:33:34   117.28   100   @Bid
16:33:34   117.30   400   @Ask
16:33:32  ↓117.20   1000  @Bid
16:33:30   117.25   100   @Ask
That snippet shows price ticking up on aggressive buying (multiple @Ask prints in green), then a seller stepping in at 117.20 to dump 1000 shares (@Bid print, larger size, downtick). Reading two minutes of this tells you who’s in control right now.
What to Watch For
Buying pressure (multiple @Ask prints in a row). Aggressive buyers are willing to pay the offer. If they keep coming and the offer keeps lifting, you have momentum. If the offers stop refreshing, the move stalls.
Selling pressure (multiple @Bid prints in a row). Aggressive sellers are willing to hit the bid. Sustained @Bid prints mean someone is unloading; price will keep falling until either the seller is done or buyers step in.
Block trades. A single print of 10,000+ shares is unusual for most active stocks. A 100,000-share block at the mid-price is institutional. Whether it’s bullish or bearish depends on what happens next: was that block absorbed and price continued up, or was it the top tick? The tape that follows tells you.
Cluster prints (the same price, multiple times, at the same second). Often signals an iceberg order being filled. The book showed 100 shares at 117.50; you see 8 separate prints of 100 shares each at 117.50 in the same second. That’s not a coincidence - it’s a hidden order getting hit.
Tape goes quiet. Empty seconds during what should be active hours mean liquidity has dried up. Either you’re in a thin name (small float, low volume), or the broader market just paused. Don’t initiate new positions during dead tape.
Off-bid / off-ask prints. Trades that print outside the visible spread (-- in the @ column when price is between bid and ask, or sometimes well outside) are usually dark pool prints, midpoint prints, or block crosses negotiated off-exchange. Less actionable for short-term timing but useful as institutional signal.
Block Trades and Filtering
Scanz Time & Sales shows every print, not just blocks. There’s no built-in size filter on the tape itself - if you’re looking specifically for blocks, the workflow is:
- Watch the SIZE column. Anything over 5,000-10,000 shares is worth a glance for a typical mid-cap stock; anything over 50,000 is a real block.
- Use the Signals scanner for block-trade events across many stocks at once. The Signals system can fire on size thresholds, where the tape itself just shows you the stream.
If you’re sitting on one ticker and watching for blocks, the tape works fine. If you’re scanning the whole market for unusual block activity, Signals is the right tool.
Prints + Level 2 Together
The pair is much more powerful than either alone:
- Level 2 shows posted intent. The bids and offers people are willing to display.
- Prints show realized action. The trades that actually executed.
When the book shows 50,000 size at 117.50 (visible offer) and you see a print for 50,000 at 117.50 followed by the offer immediately reposting at 117.55 - that’s a real seller refilling. When the book shows 50,000 at 117.50, you see a single print for 100 shares, and then the offer disappears and reappears at 117.40 - that was a fake (got nibbled, pulled, re-posted lower).
Most experienced tape readers are watching both panels at once. The book sets the question; the tape provides the answer.
For more on Level 2 specifically, see the Level 2 guide.

Tips for Reading Prints
Don’t read every tick. On a high-volume name, prints fly by faster than you can process. Train your eye on the size column - your peripheral vision will catch the big prints; ignore the 100-share noise.
Watch tape during specific events. The first 5 minutes after the open, the lunch lull, the 3:00 PM reawakening, the close - these are the moments where the tape character changes. A name that’s quiet at lunch but suddenly prints aggressively at 1:30 is doing something interesting.
Slower tape on a chart you like is bullish. Counter-intuitive but useful: a stock you think is going up should consolidate on slower tape, then accelerate. If it’s already accelerated and the tape is loud, you’re late. The best entries come when tape goes quiet at a level - then prints start flickering back to life.
Round-number prints don’t tell you much. 100, 200, 1000-share prints at round-number prices are almost certainly retail. Look for off-round prints (537, 1,283, 4,851 shares) at off-round prices - those are working orders, not knee-jerk reactions.
The tape doesn’t lie, but it can mislead. A flurry of @Bid prints can be one stop-loss algo flushing, not real selling. A burst of @Ask prints can be a single algo accumulating, not the start of a move. Wait for confirmation - usually a few seconds - before acting on tape character alone.
Troubleshooting
Time & Sales is empty Check the session. Outside regular hours, only some venues report; tape goes very quiet in early PM and late AH. If the chart shows price moving but the tape shows nothing, refresh - you may have a connection issue.
I see prints from venues I’ve never heard of
The -- column is just where the print landed. The tape doesn’t always show the venue (the Time & Sales view is price-focused, not exchange-focused). If you need exchange-level routing detail, the Montage Level 2 Log panel shows market-maker activity by venue.
Prints look out of order Prints stream by execution time, not posting time, and there can be small delays from different exchanges. The TIME column is exchange-reported time, so a NYSE print and a NASDAQ print at the same second may arrive in your feed seconds apart. This is normal market microstructure, not a Scanz issue.
The arrow direction doesn’t match my expectation
The up/down arrow is tick direction (compared to the previous print at any venue), not direction relative to mid-price. A ↓ arrow on an @Ask print just means the previous print was higher - you’re still looking at a buyer who lifted, but at a slightly lower offer than the last one.
Related Features
- Level 2 - The order book Prints pairs with
- Signals - Pattern alerts including block-trade signals across many stocks
- QuickView - The panel that holds Prints alongside Charts and Level 2
Ready to try it? Start your 7-day free trial. No commitment, cancel anytime.