Charts
Built-in charting with 12 timeframes, 100+ technical indicators, drawing tools, and saved layouts. Available inside QuickView and the full-page Montage view.
Scanz ships with a full charting engine built directly into the platform - no separate window, no third-party redirect. You get candlestick charts with 12 timeframes from 1-minute up to monthly, over 100 technical indicators, a complete set of drawing tools, and the ability to save chart layouts as named views you can recall later.
Charts live in two places. In QuickView, the slide-out panel that opens when you click any ticker, the chart sits at the top of the panel - good for quick reads while you keep scanning. The Montage view (right-click a ticker → Open in New Tab) gives you a full-page chart at /ticker/{exchange}/{symbol} with more vertical space and the chart toolbar fully expanded.
Both views use the same chart engine, so anything you set up in one place - indicators, drawings, chart type - is available in the other.
Where Charts Live
Inside QuickView. Click any ticker in Scanner, Signals, Watchlists, ETFs, or anywhere else, and QuickView slides in from the right with the chart at the top. This is the default everyday view. The chart toolbar sits along the top edge of the chart with chart type, timeframe, saved views, indicators, and settings. Below the chart you’ll find News and Prints & L2 tabs.
Inside Montage (full-page). Right-click a ticker and choose Open in New Tab. You’ll land on a dedicated /ticker/EXCHANGE/SYMBOL page with the chart taking up the left two-thirds of the screen. The right side shows live stats (LAST, BID, ASK, VOLUME, $VOLUME, TRADES, FLOAT, ROTATION, PRV CLS, OPEN, HIGH, LOW, 52W HI, 52W LO) plus a Time & Sales feed. Below the chart you get tabs for Level 2, News, Filings, and News & Filings - the deep-dive view for when you’re committing to a name.
There’s no separate “Charts” page or workspace. You always reach the chart through a ticker - which is the right model: a chart of nothing isn’t useful, and starting from the symbol means you’re always reading the same context (last price, news, depth) alongside the chart.
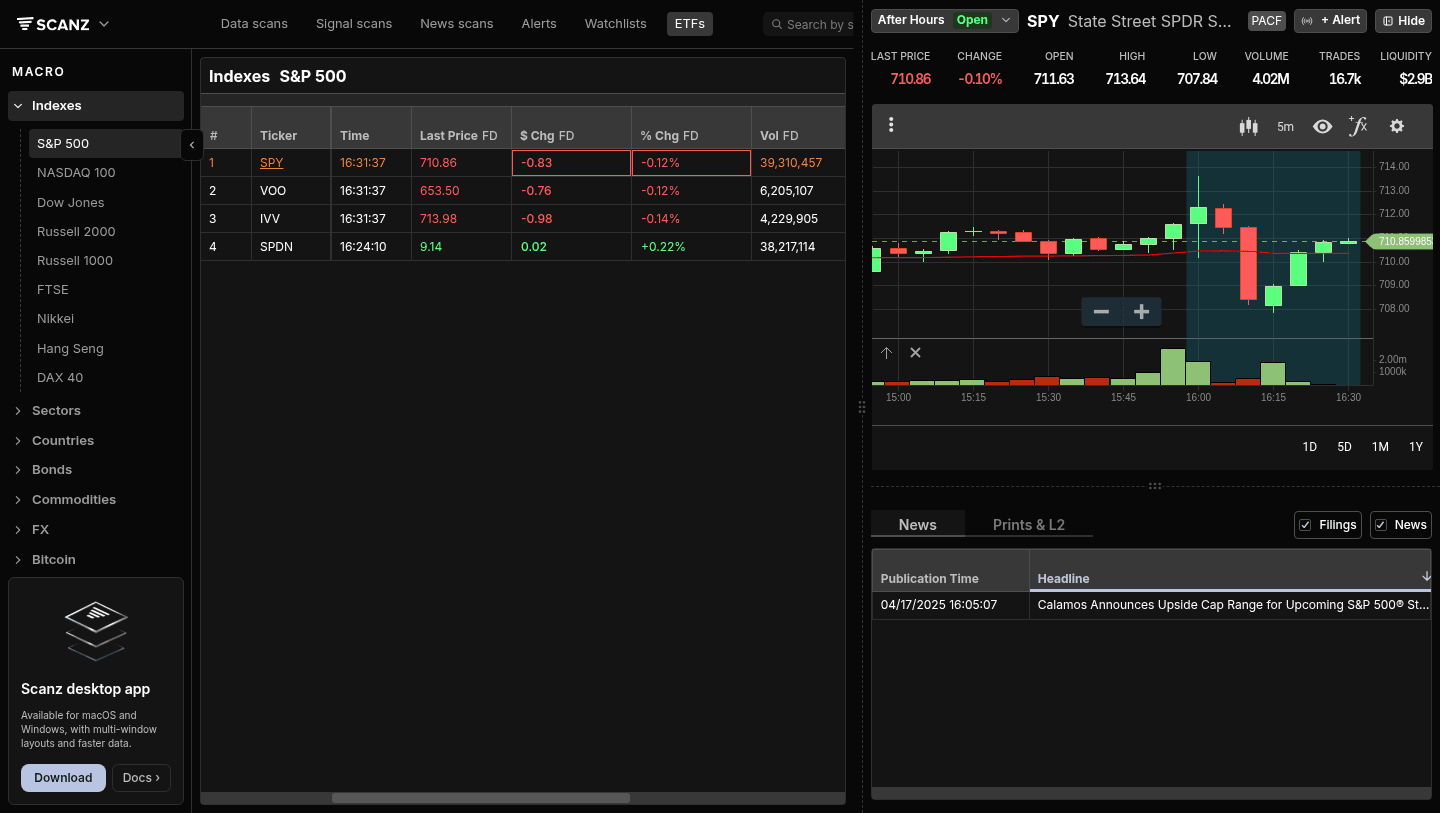
Chart Types and Timeframes
The candlestick icon opens the Chart Types menu - ten styles: Candle (default), Bar, Colored Bar, Line, Colored Line, Vertex Line, Step, Mountain, Baseline, and Hollow Candle. Most active traders stay on Candle for intraday and switch to Line or Mountain on longer timeframes for cleaner trend reads.
The timeframe selector (default 5m) opens a dropdown with twelve choices: 1 D, 1 W, 1 Mo for higher timeframes, and 1/2/3/5/10/15/30 Min, 1 Hour, 4 Hour for intraday. A second row of bottom-bar buttons (1D 5D 1M 3M 6M YTD 1Y 5Y All) sets the visible range, independent of candle size - so you can run 5-minute candles across a 5-day range, or 1-day candles across 5 years.
The intraday timeframes are where most active traders live. 1-minute is the standard for entry timing on momentum names; 5-minute and 15-minute give you trend context without the noise; 1-hour and 4-hour are the swing trader’s view.
Saved Views
The eye icon in the toolbar opens Saved Views. Click Save View to capture your current chart setup - chart type, timeframe, indicators, drawings - as a named view. Later, click the eye icon and choose any saved view to instantly restore it.
This is useful when you have multiple “modes” you switch between. A scalper’s setup (1-min candles, VWAP, volume profile, no other indicators) is different from a swing trader’s setup (1-hour candles, 20/50/200 EMAs, RSI, MACD). Save both and toggle. The view is per-symbol-independent - applying it to NVDA loads the same indicators and timeframe regardless of what you were just looking at.
Indicators (Studies)
The fx icon in the toolbar opens the Studies panel. Two volume / VWAP studies are active by default - you’ll see them listed under Active Studies at the top, each with a toggle to show/hide and an X to remove. Below that, the searchable Studies list lets you add anything from a 100+ indicator library.
The library covers every category most active traders need - trend (Moving Averages, MACD, Supertrend, Parabolic SAR, Aroon, ADX), momentum (RSI, Stochastics, Williams %R, CCI, Ultimate Oscillator), volatility (Bollinger Bands, ATR, Keltner Channel, Donchian Channel), volume (Volume Profile, OBV, Chaikin Money Flow, Money Flow Index), levels (VWAP, Anchored VWAP, Pivot Points), and specialty studies (Ichimoku Clouds, Fractal Chaos Bands, Darvas Box, Elder systems, Pring’s Know Sure Thing).
For most active trading, three to five indicators is enough. VWAP plus a couple of moving averages is the common momentum setup. Bollinger Bands and RSI is the common mean-reversion setup. Stacking 15 indicators on one chart usually means you don’t trust any of them - tighten up.
Use the Search box at the top of the Studies list to find an indicator by name - the list is long enough that scrolling gets tiring.
Drawing Tools
The pencil icon on the left edge of the chart opens the Drawing Tools panel with a category filter (All, Favorites, Fibonacci, Lines, Markings, Statistics, Technicals, Text). The category filter is your friend - the full list includes dozens of tools.
The drawing tools cover Lines (trendlines, horizontal/vertical, channels, rays), Fibonacci (retracements, extensions, fans, time zones, arcs), Markings (annotations, arrows, callouts), Statistics (average lines, regression channels), Technicals (Andrews’ Pitchfork, Gann fan, Elliott Wave labels), and Text labels.
Once a tool is selected, click on the chart to anchor it. The toolbar at the top of the drawing panel includes select, eraser, undo, and redo. The bottom toolbar has snap-to-price (the magnet icon), trash all, and reset. Star a tool to add it to Favorites so you don’t have to dig through categories every time.
Drawings persist on the chart until you explicitly remove them, and they save with your Saved Views. So you can have a NVDA chart with key support/resistance marked, save it as “NVDA levels,” and pull it up next week with everything still drawn.
Chart Settings
The gear icon opens Chart Preferences: a Range Selector toggle (the bottom-bar 1D/5D/1M buttons), Extended Hours toggle (on by default - the shaded vertical bands on intraday charts mark RH session edges), Y-Axis Log Scale and Invert toggles, and a Shortcuts / Hotkeys reference.
Extended Hours on is the right default for active traders - PM and AH activity often signals what’s coming at the open. Flip Log Scale on when you’re looking at a multi-year chart of a stock that’s gone 10x; the linear scale makes the early action look flat.
Tips for Better Chart Reads
Match the timeframe to the trade. A scalp doesn’t need a 1-hour chart; a swing doesn’t need 1-minute candles. Reading the wrong timeframe is the most common reason setups look obvious in hindsight but you missed them live - you were zoomed in too far, or zoomed out too far.
Use Saved Views to enforce consistency. If every chart you read uses different indicators, you’re not really comparing them. Lock in a setup as a saved view and apply it to every name. Patterns become more recognizable when the picture is the same.
Don’t draw on every chart. Drawing trend lines and support/resistance everywhere makes you see patterns that aren’t there. Reserve drawings for charts you actually trade. Treat the drawings as commitments, not exploration.
VWAP is the single most useful intraday indicator. Add it once and leave it. Price above VWAP = bullish bias; below = bearish bias. Half of intraday momentum trading is just trading in the direction of VWAP.
Right-click for Montage when you’re committing. QuickView’s chart is fine for scanning. When you’re about to trade a name, open the full Montage view - the bigger chart, the live stats panel, and the Level 2 tab below all in one place is what you want when size is on the line.

Troubleshooting
Indicators disappeared after switching tickers Indicators applied via the chart toolbar are per-session; they don’t carry across symbols unless you save them as a View. Save your setup as a default View and apply it after switching.
Chart is blank on a small-cap or recent IPO Some symbols have limited history at the longer timeframes. Drop to 1-Day or 5-Day range and 1-minute or 5-minute candles - the data is usually there at intraday resolution even when the longer history is sparse.
Drawings vanish when I switch ticker Drawings are per-symbol. Switch back to the original symbol and they’ll be there. Save the chart as a View if you want a snapshot you can restore.
The Extended Hours band is missing Open the gear icon and confirm Extended Hours is on. On daily and weekly timeframes, extended hours don’t render (they’re aggregated into the daily bar) - the band only shows on intraday.
Related Features
- QuickView - The slide-out panel that holds the chart alongside news and Level 2
- Level 2 - Order book depth, available below the chart
- Prints - Time & Sales feed, paired with Level 2
Ready to try it? Start your 7-day free trial. No commitment, cancel anytime.